How to track resource usage of cluster pods?
-
Access your Cluster Interface in Gita:
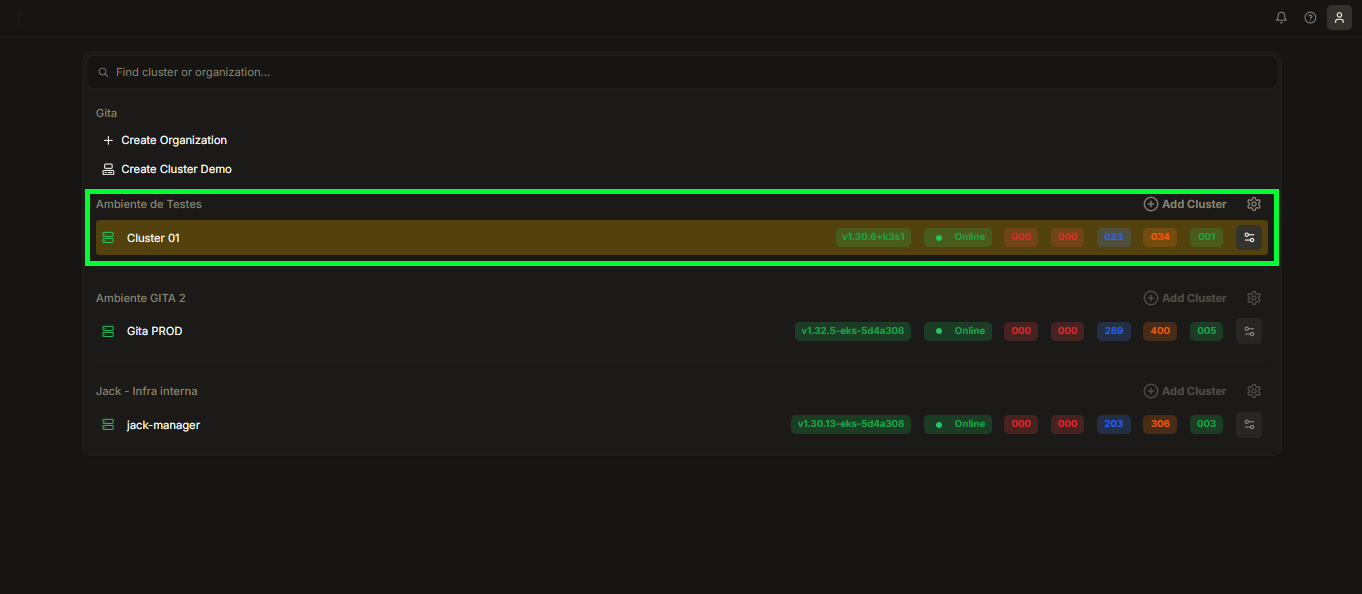
Image 01: Cluster Selection Panel
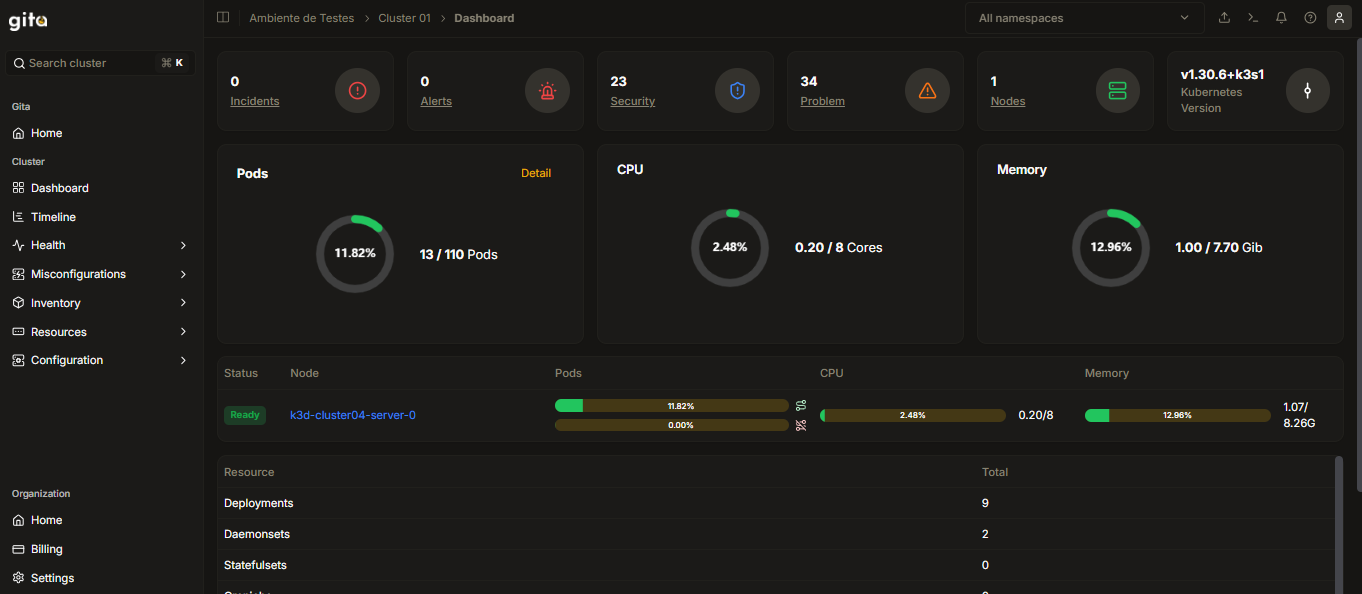
Image 02: Cluster Interface
-
Click on the Health section on the left side of the Interface screen:
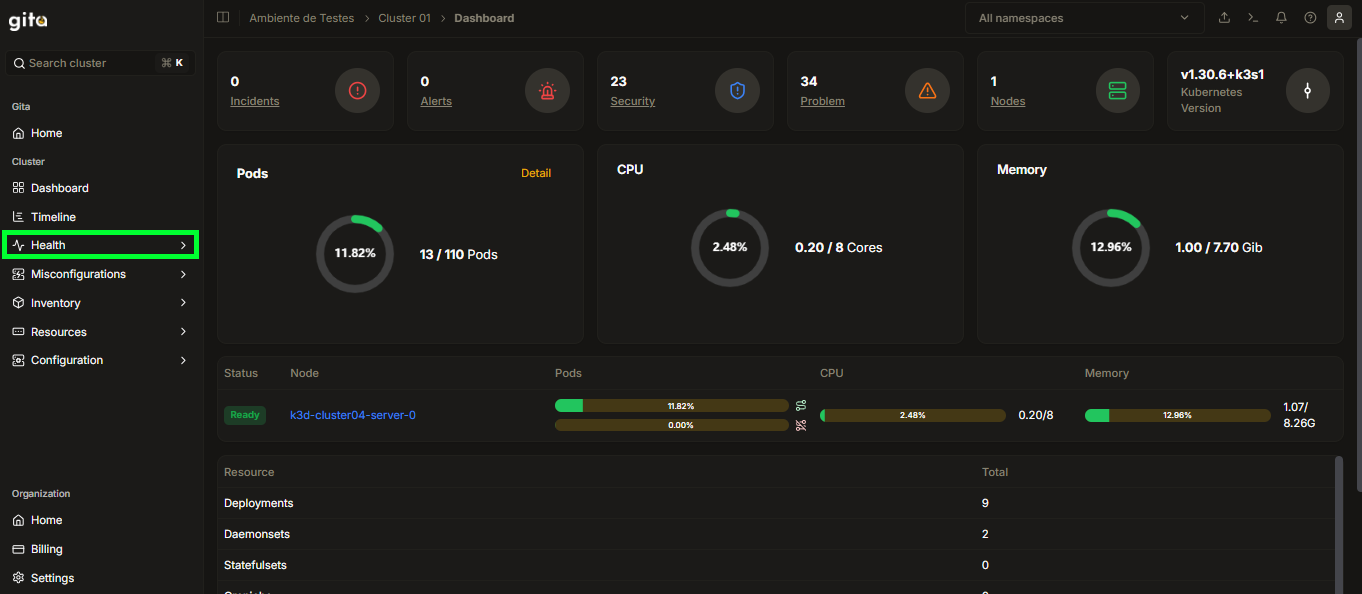
Image 03: Health Section
-
Inside the Health section, click on the Top Pods section:
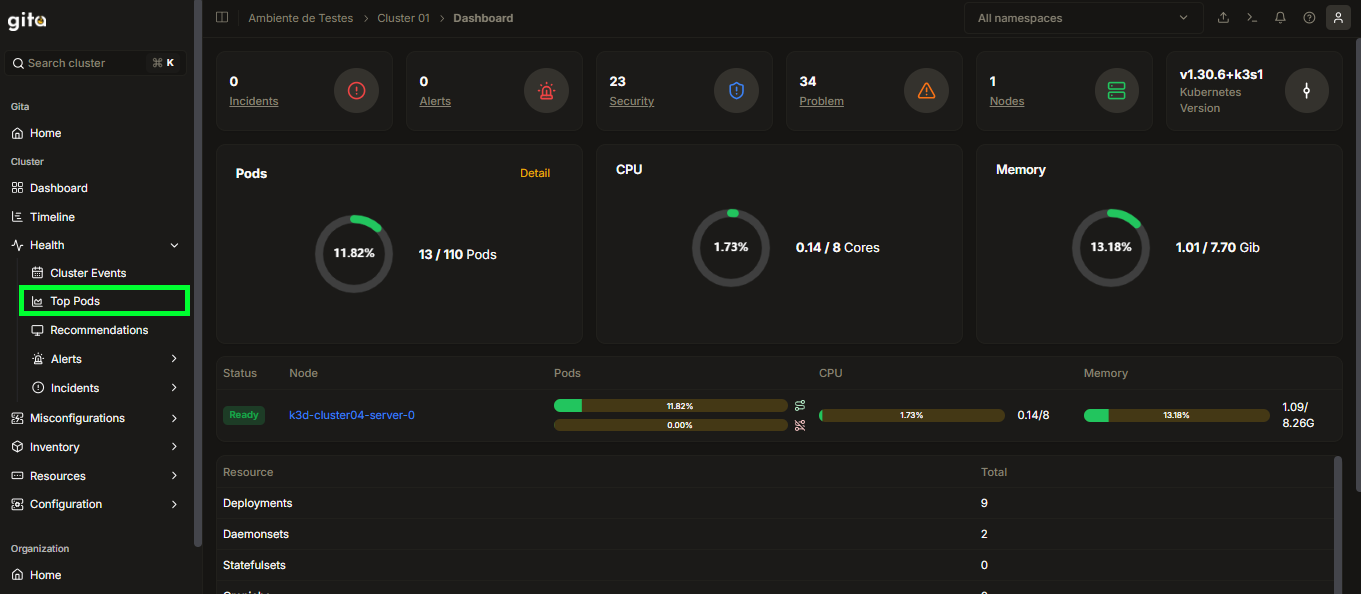
Image 04: Top Pods Section
-
In the Top Pods tab, you can track the memory and CPU usage of your cluster's pods based on a "treemap". Just click on the Memory or CPU tab within the Top Pods section:
What is a treemap?
A treemap is a type of graphical visualization that uses proportional rectangles to represent hierarchical or quantitative data. In the context of Gita, each rectangle represents a pod, and the size of each rectangle indicates the memory or CPU consumption of that pod relative to the others. This way, you can quickly identify which pods are consuming the most resources in the cluster.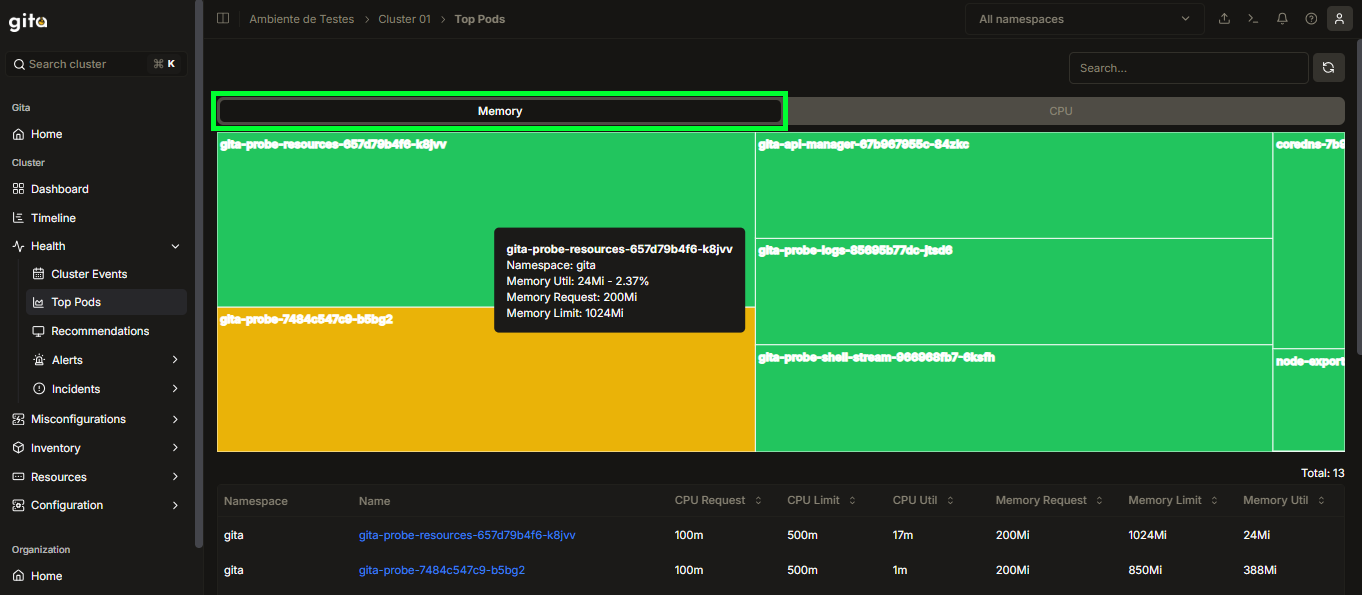
Image 05: Treemap View - Memory Consumption
Treemap Memory Usage Legend
In the Memory treemap, each rectangle represents the memory usage of a cluster pod. Hovering over a pod will show detailed information, such as:
- Pod Name: Unique identification of the pod.
- Namespace: Logical space where the pod is allocated.
- Memory Util: Memory used by the pod (in MiB and percentage).
- Memory Request: Memory requested by the pod.
- Memory Limit: Maximum memory limit allowed for the pod.
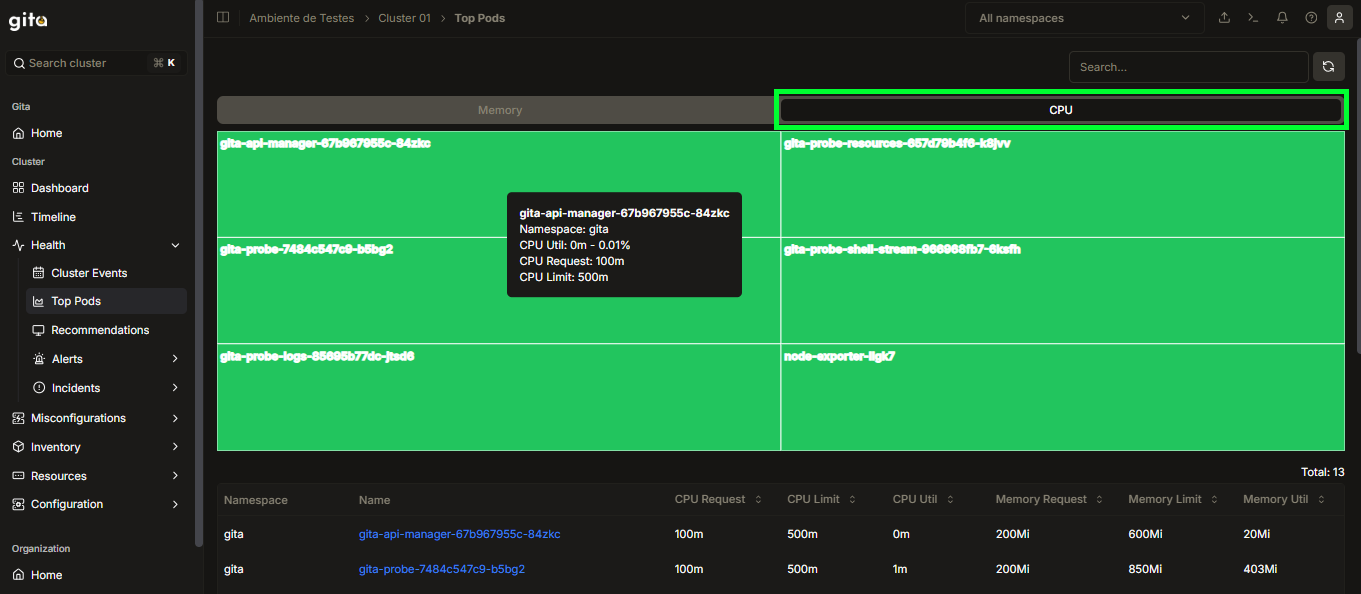
Image 06: Treemap View - CPU Consumption
Treemap CPU Usage Legend
In the CPU treemap, each rectangle represents the CPU usage of a cluster pod. Hovering over a pod will show detailed information, such as:
- Pod Name: Unique identification of the pod.
- Namespace: Logical space where the pod is allocated.
- CPU Util: CPU used by the pod (in millicores and percentage).
- CPU Request: CPU requested by the pod.
- CPU Limit: Maximum CPU limit allowed for the pod.
Treemap Color Scheme
The treemaps use a color scheme to indicate the level of memory (or CPU) usage of each pod, making it easier to visually identify pods that are consuming more resources:
-
Green:
Resource usage is low (less than 40%). Indicates the pod is using little memory/CPU and is within a safe range. -
Yellow:
Resource usage is moderate (between 40% and 59%). Indicates attention, as consumption is increasing but not yet critical. -
Orange:
Resource usage is high (between 60% and 79%). Indicates alert, as the pod is consuming a significant amount of memory/CPU and may be approaching the limit. -
Red:
Resource usage is very high (80% or more). Indicates risk, as the pod is close to the memory/CPU limit and may suffer throttling or be restarted by the cluster.
- In the Top Pods tab, in addition to the treemap view, just below you can analyze the Memory or CPU usage of the cluster's pods through a detailed table. This table allows you to filter the pods according to some parameters and sort them in ascending (Asc) or descending (Desc) order, making it easier to identify the pods that consume the most resources:
Image 07: Memory and CPU Consumption Filters View
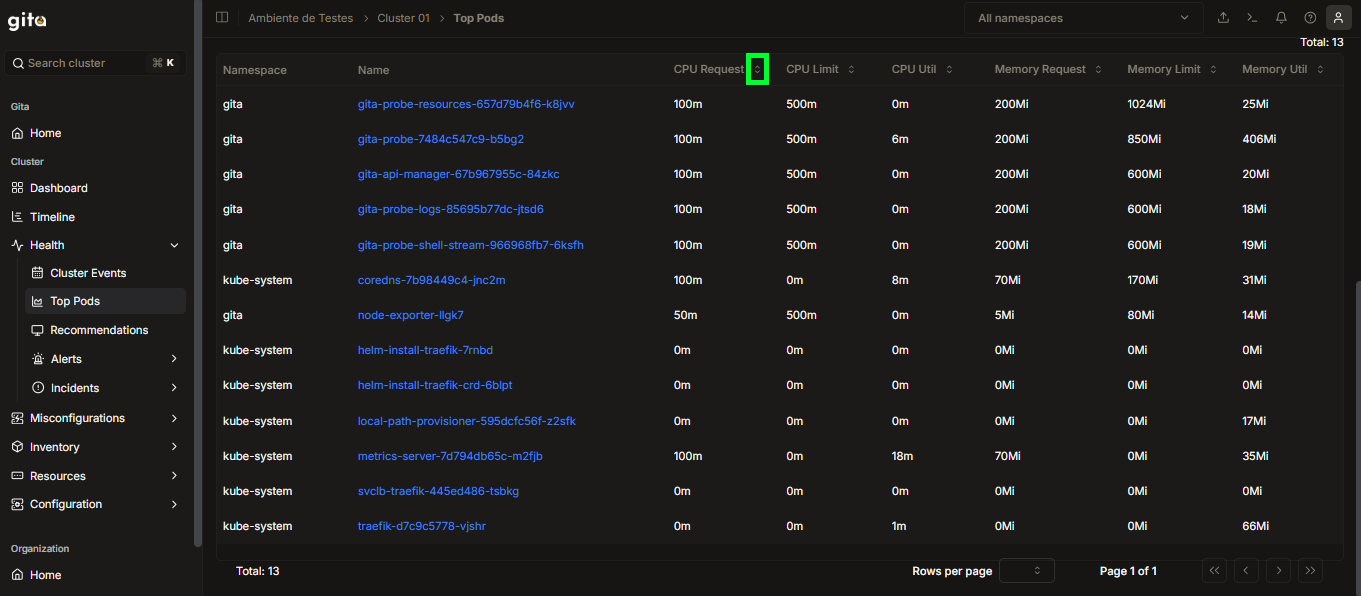
Image 08: Pod Sorting Button Based on Filters
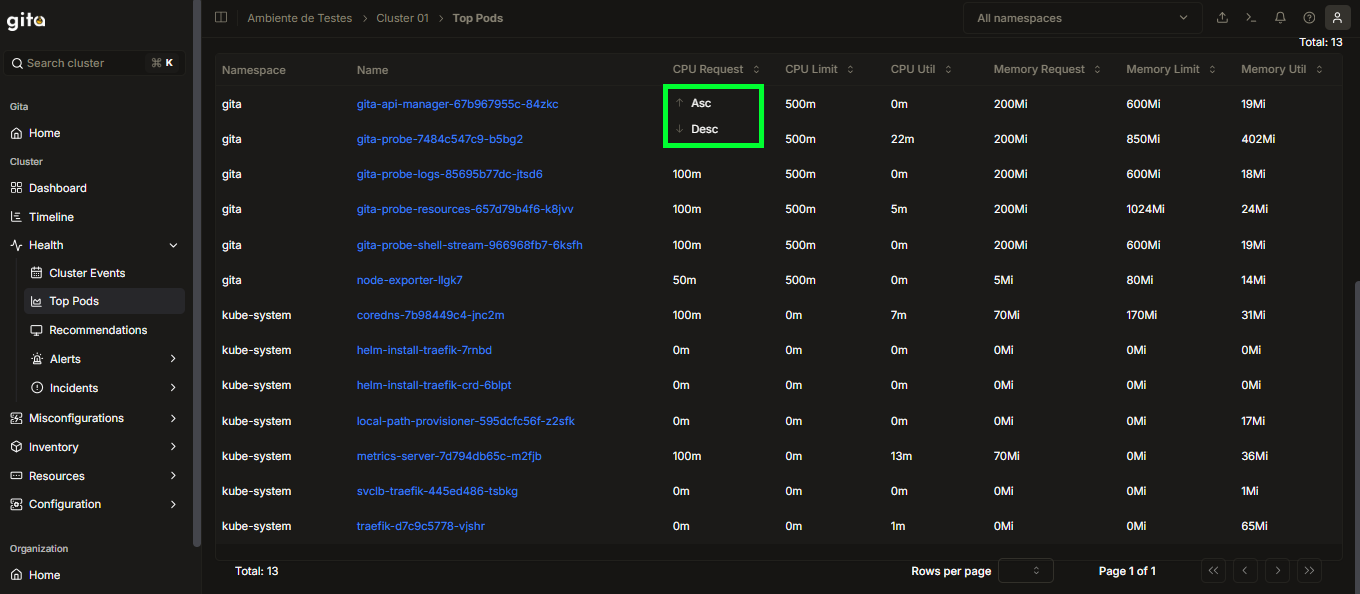
Image 09: Asc and Desc Sorting Selection View