How to View Financial Data? How does this Work on GITA?
Each user will have 15 free days to use GITA. After this period, financial data can be monitored directly through the platform interface. To view financial data:
- Access the GITA interface, choose the cluster where you want to view financial data.
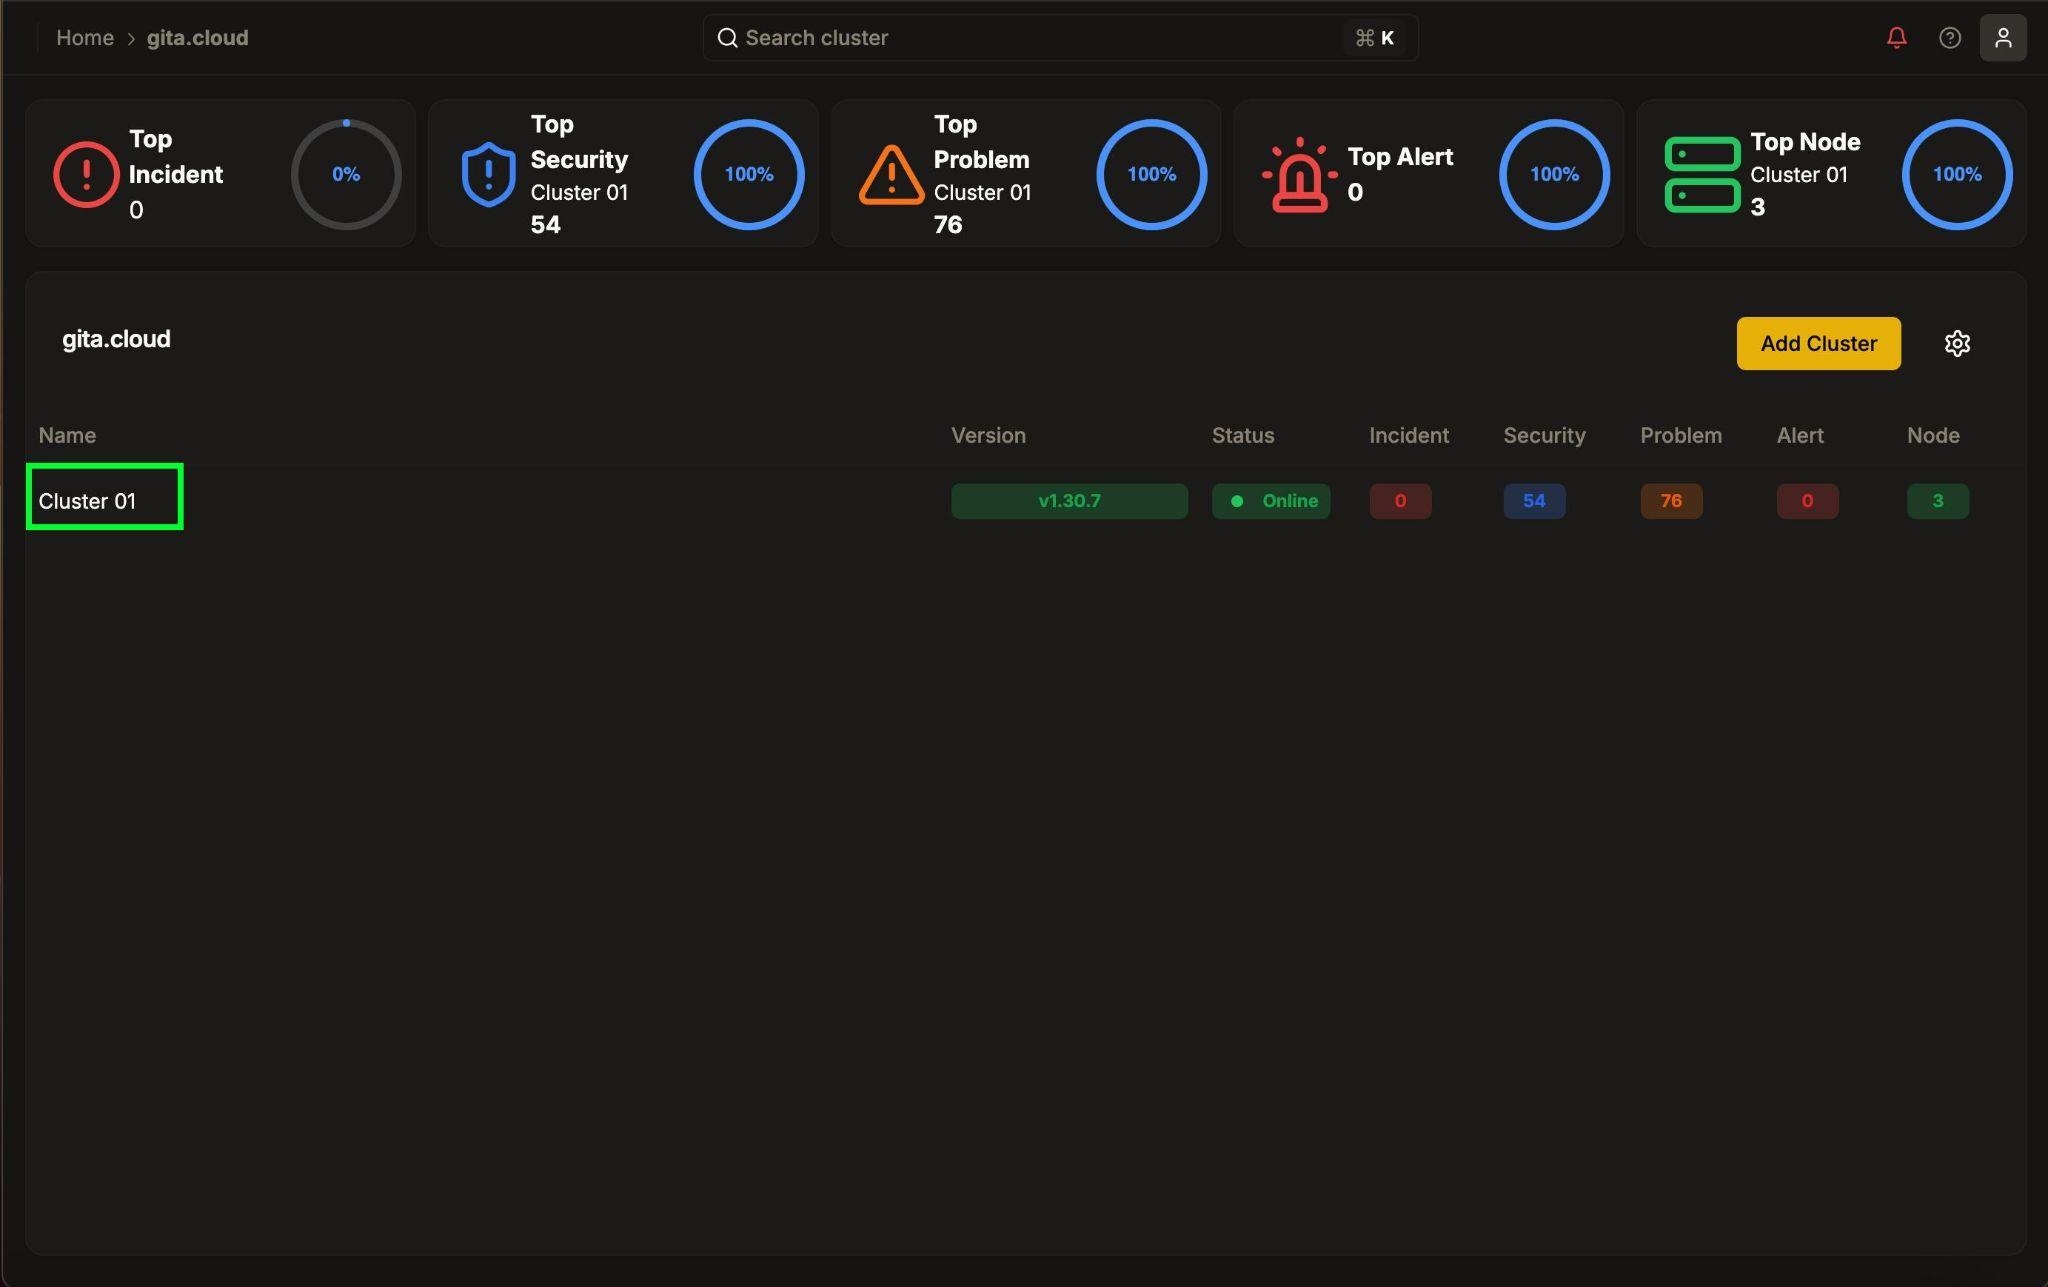
Image 01: Panel - Organization's main screen
- In the left sidebar menu that will appear, under Organization, click on Billing.
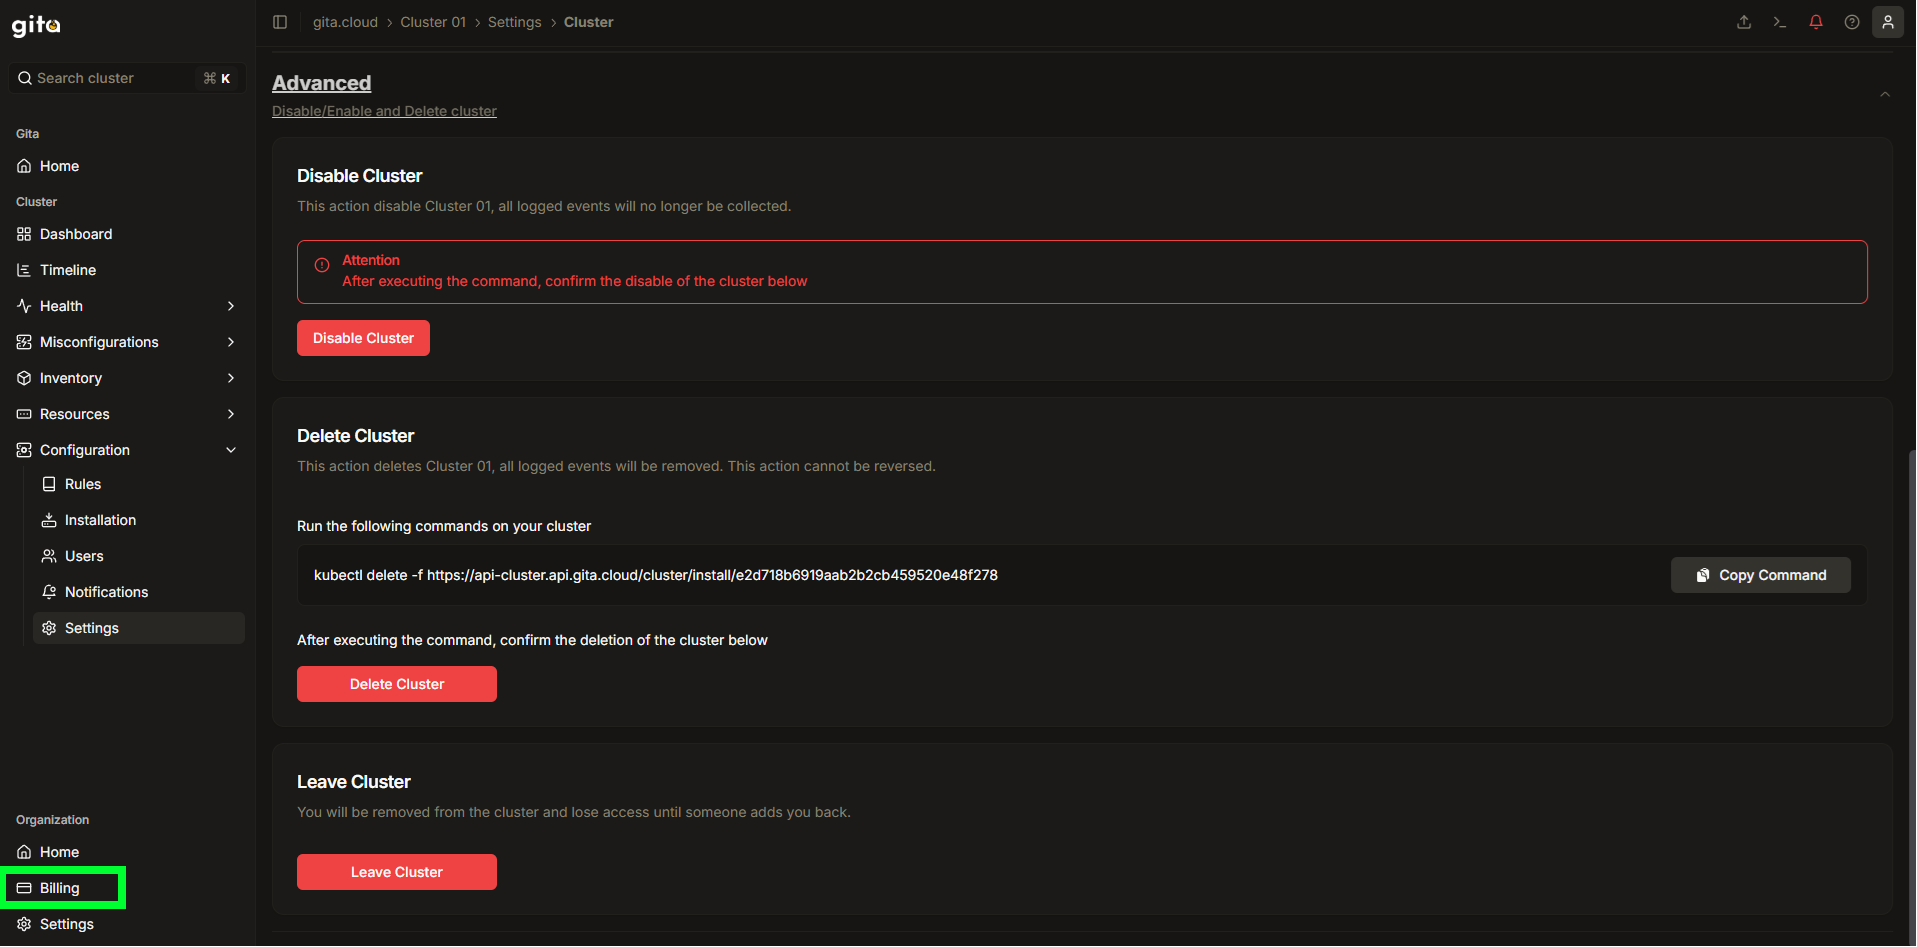
Image 02: Settings - Highlight 'Billing'
- In the sidebar menu, in the Billing section, select the desired subsection:
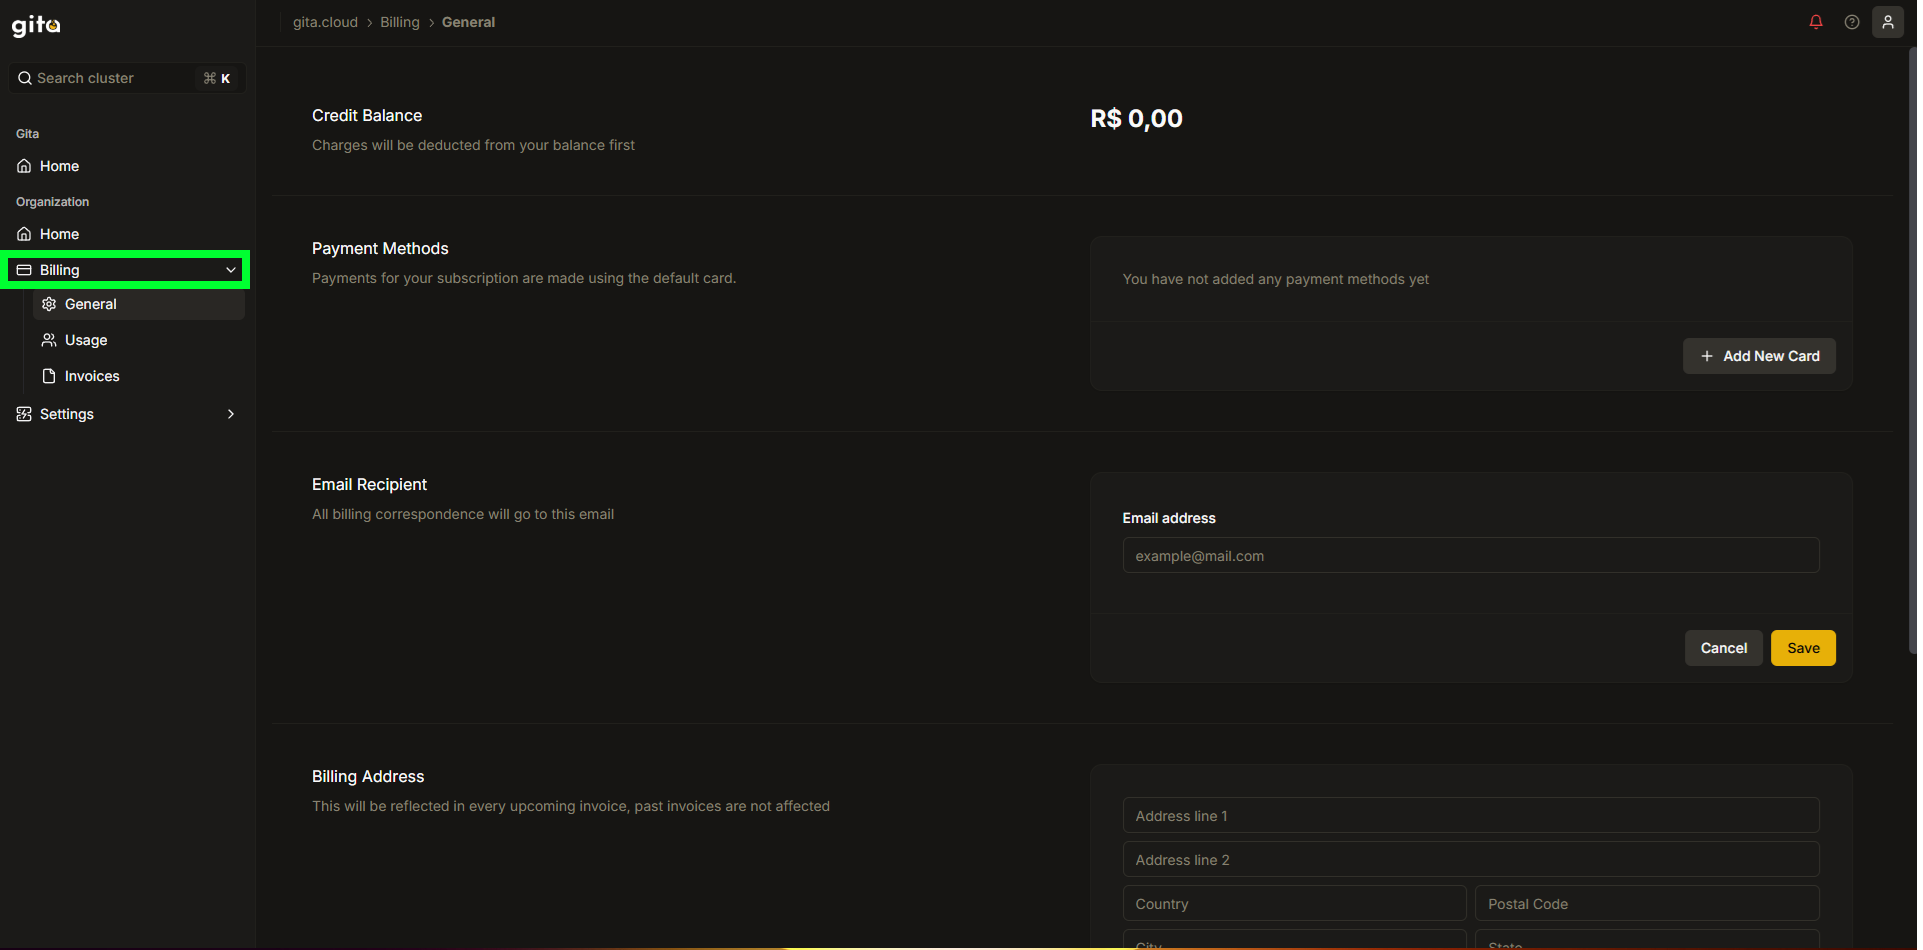
Image 03: Billing - Main panel
- General: Consolidated view of balance, payment methods, invoice email recipient and billing address.
- Usage: Displays details about consumption and billing.
- Invoices: Lists all invoices issued to the user.
1. General Section
- In the left sidebar menu, click on Billing and select the General tab to view your account payment information.
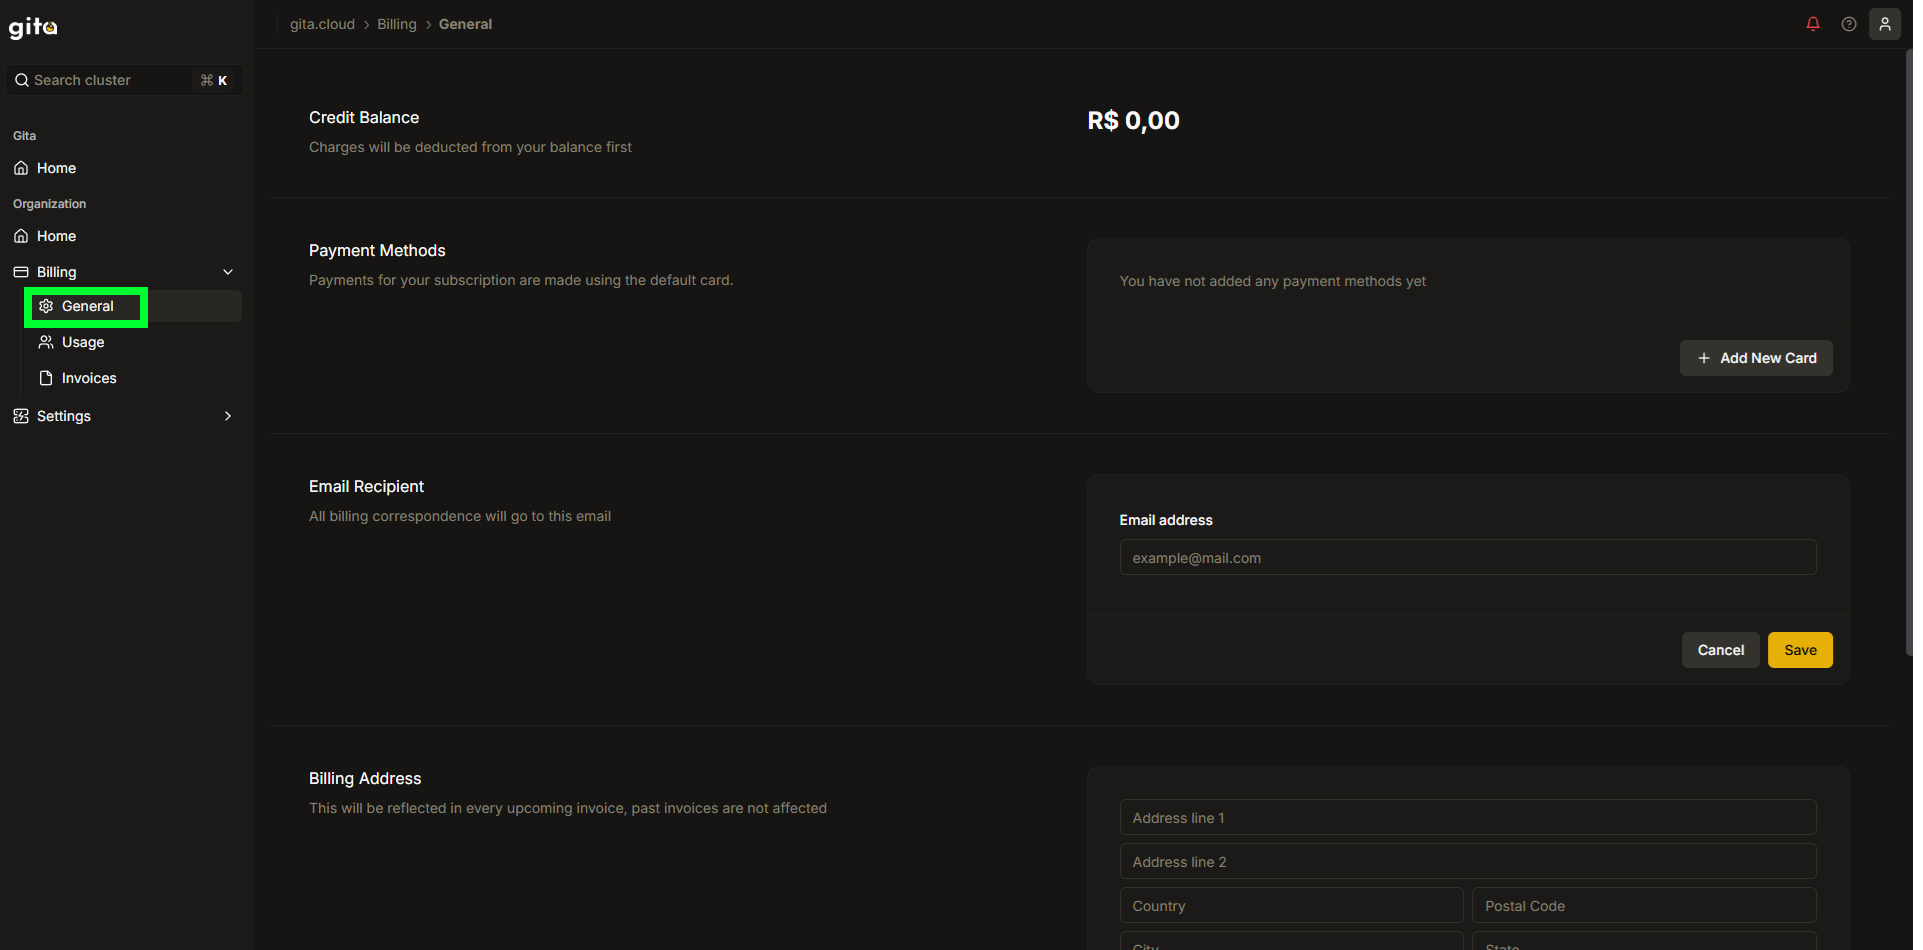
Image 04: Billing - Main Panel
- In the General tab, you will find:
- Credit Balance: Available amount before any direct card charge.
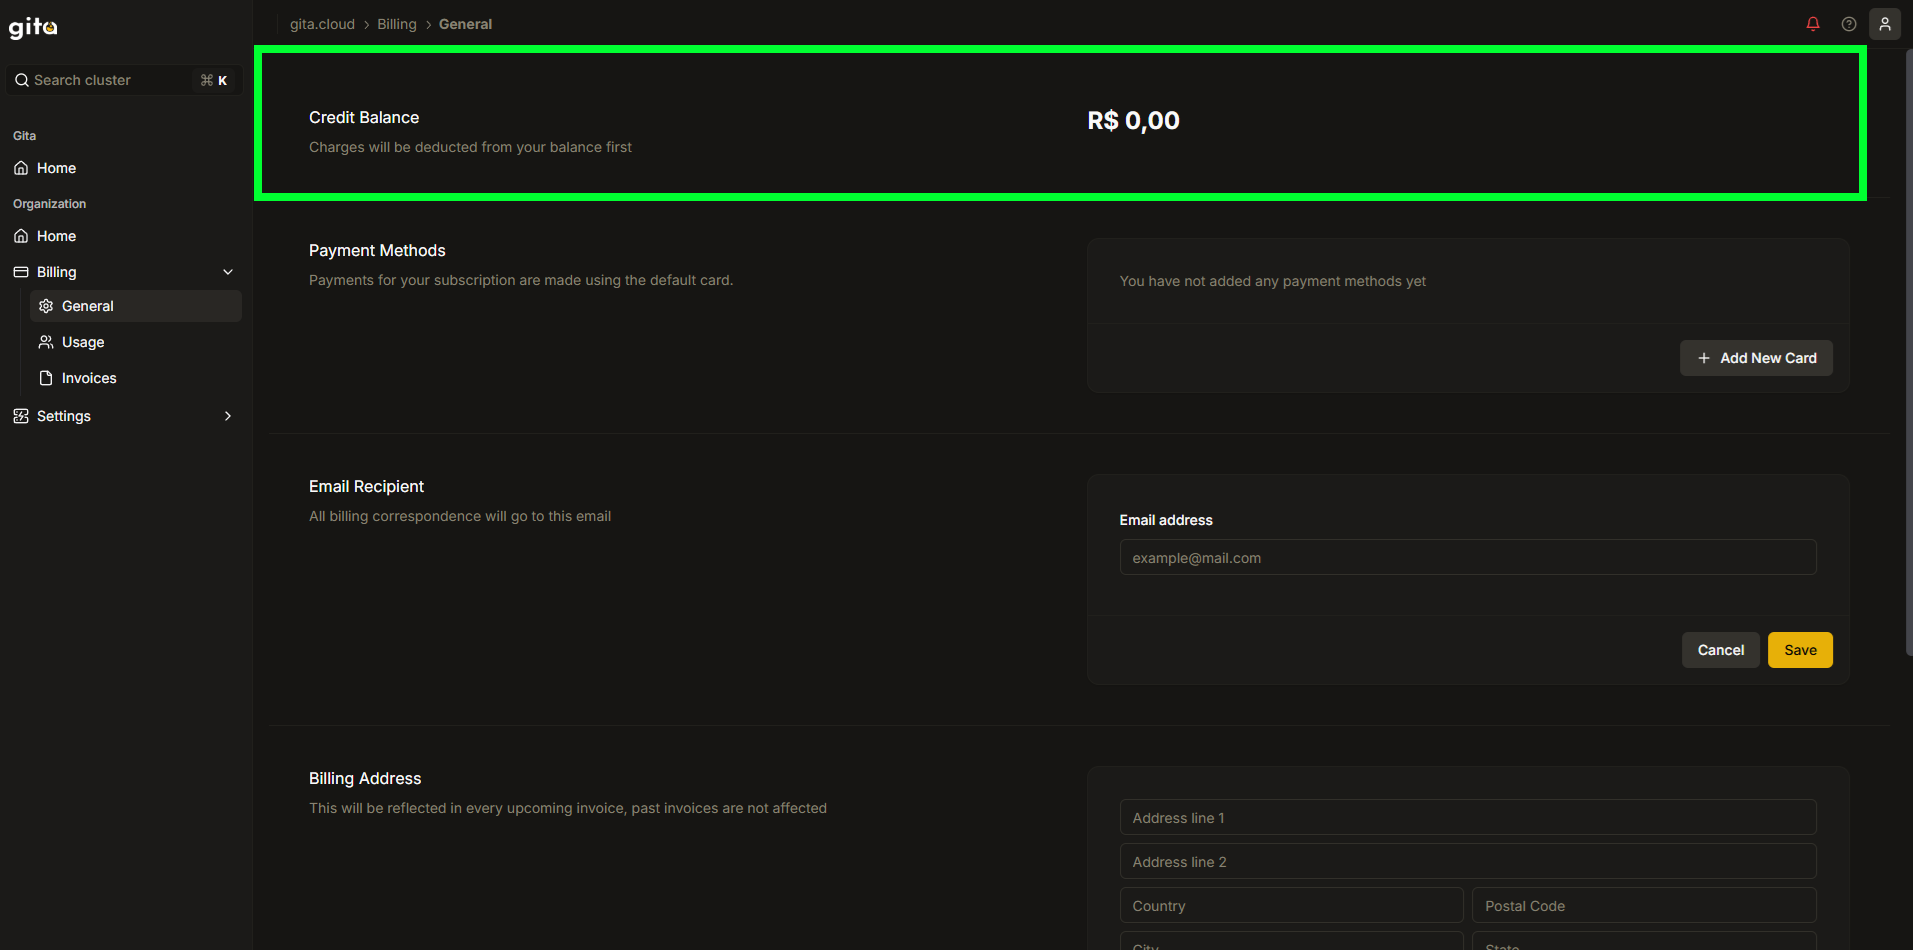
Image 05: Billing - Highlight 'Credit Balance'
- Payment Methods: Displays registered cards.
- To add a new card, click on Add New Card and follow the instructions.
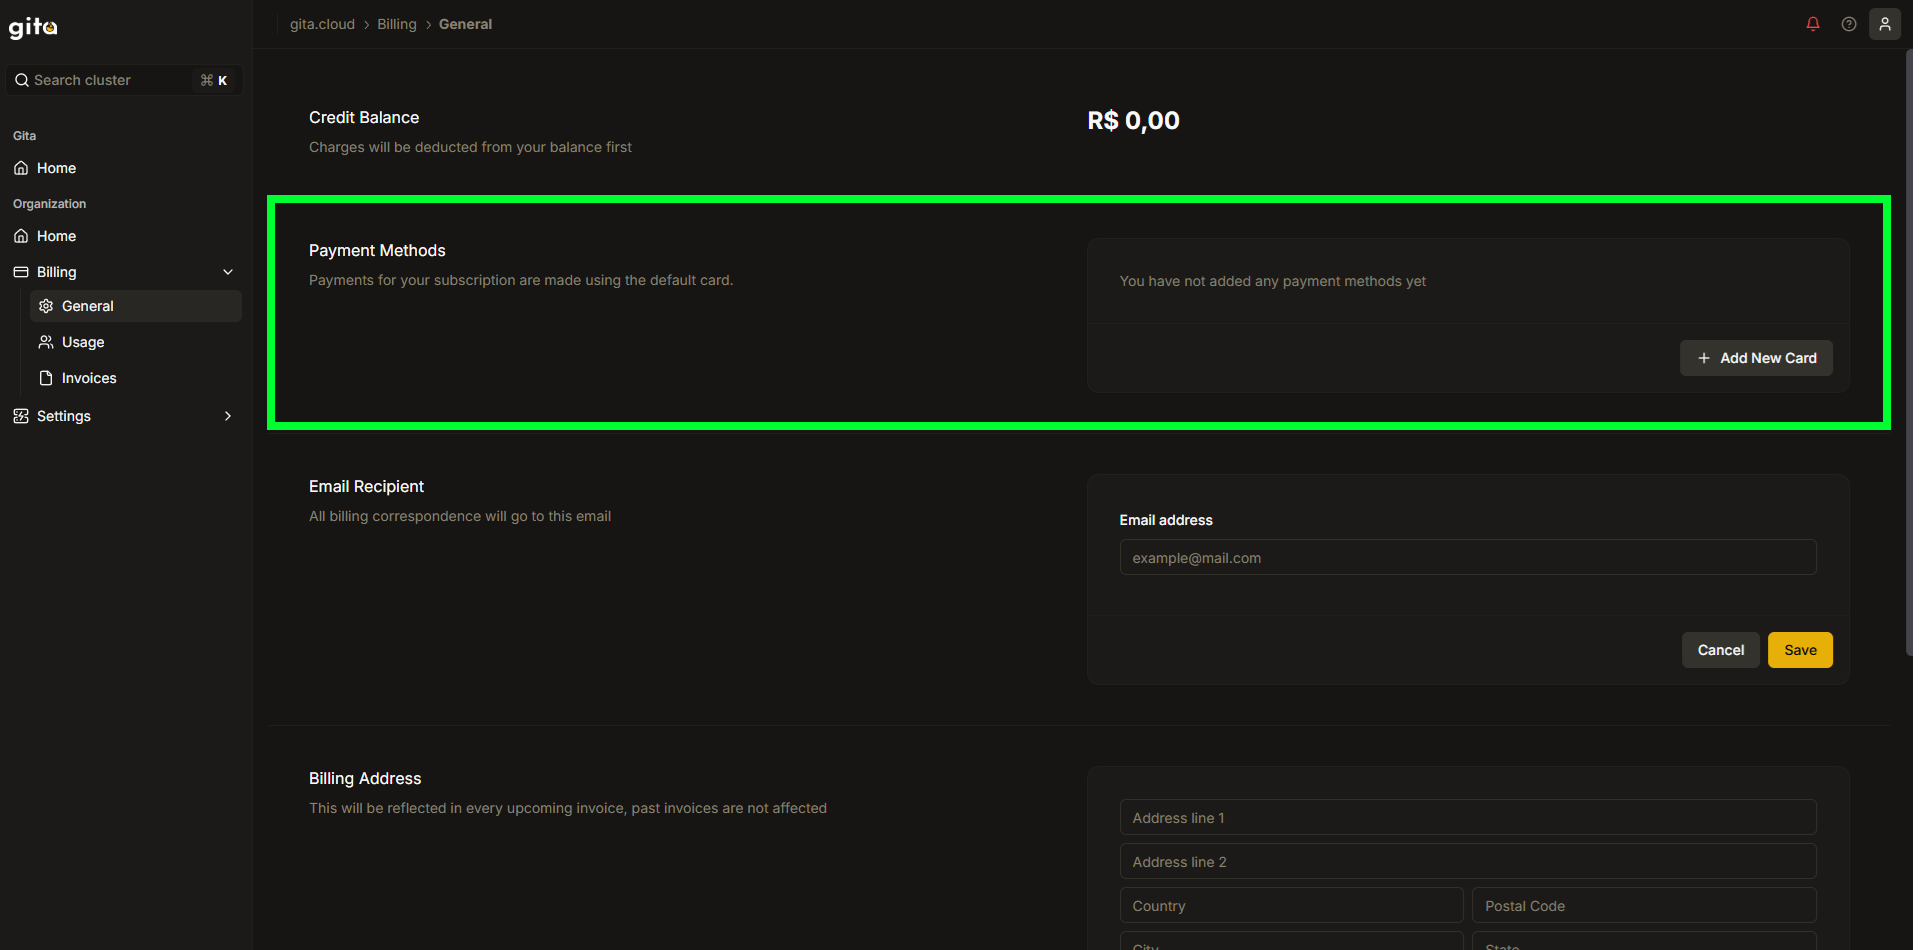
Image 06: Billing - Highlight 'Payment methods'
- To add a new card, click on Add New Card and follow the instructions.
- Invoice Email Recipient: Email where invoices are sent.
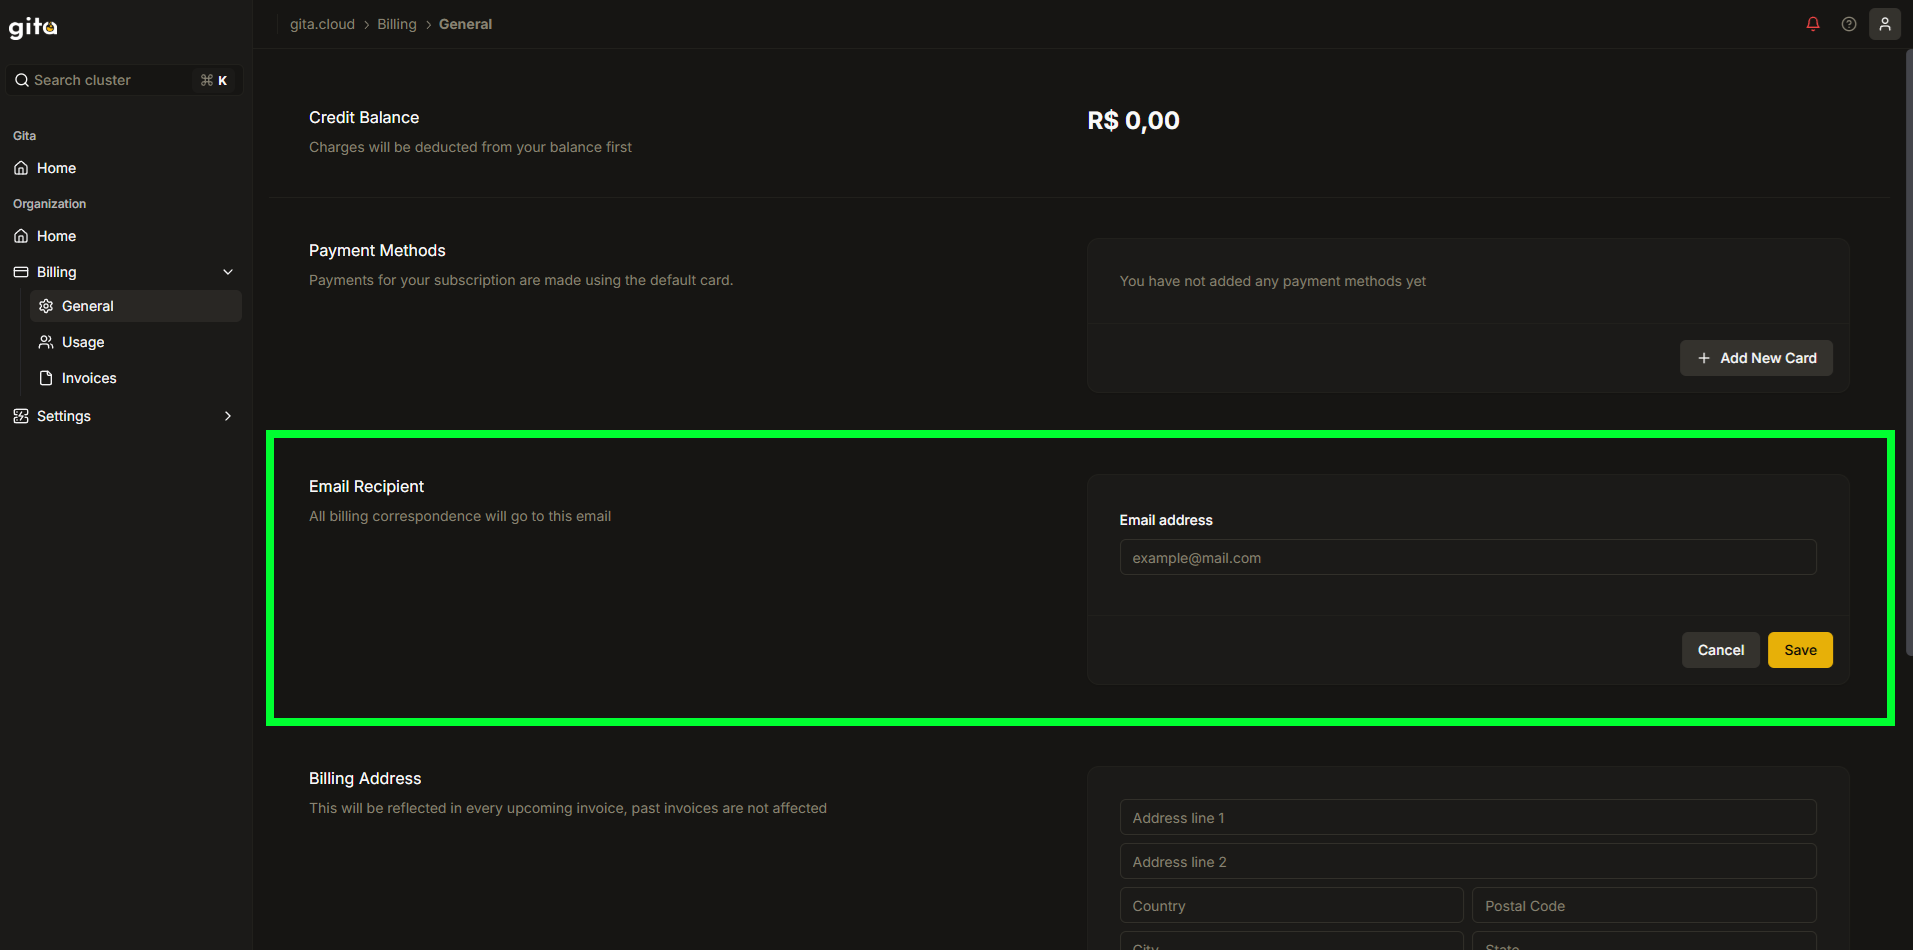
Image 07: Billing - Highlight 'Email recipient'
- Billing Address: Includes Address Line 1 and 2, Country, ZIP Code, City and State.
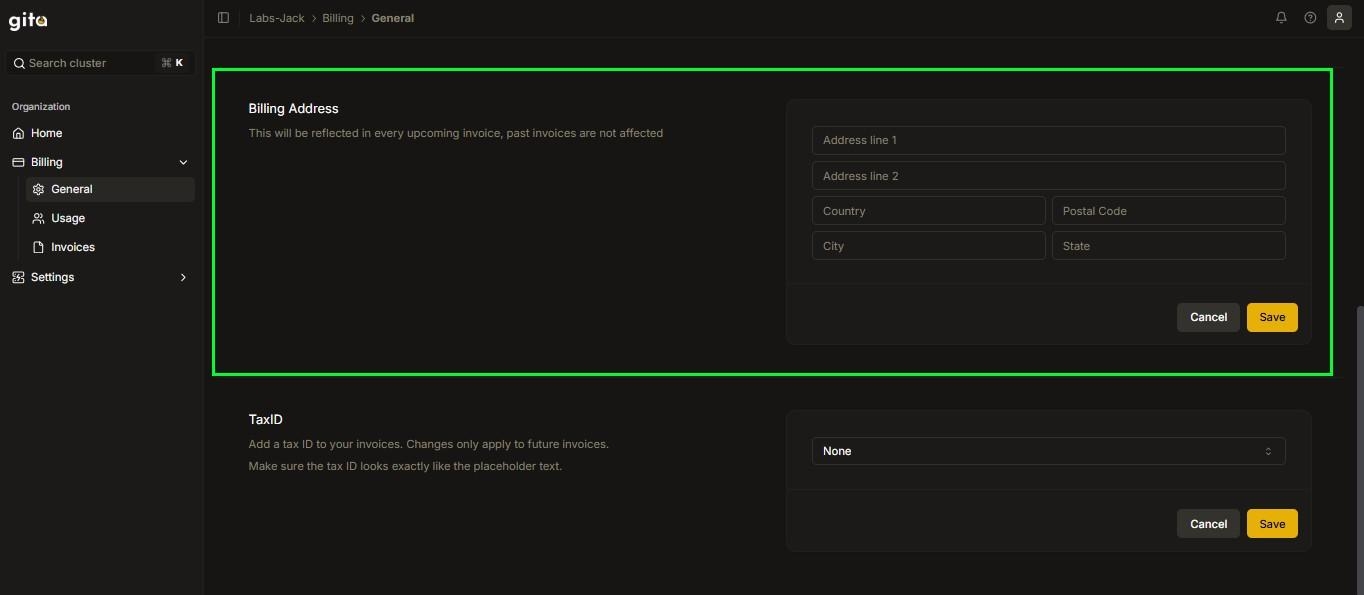
Image 08: Billing - Highlight 'Billing address'
- Tax ID: Tax identifier for future invoices.
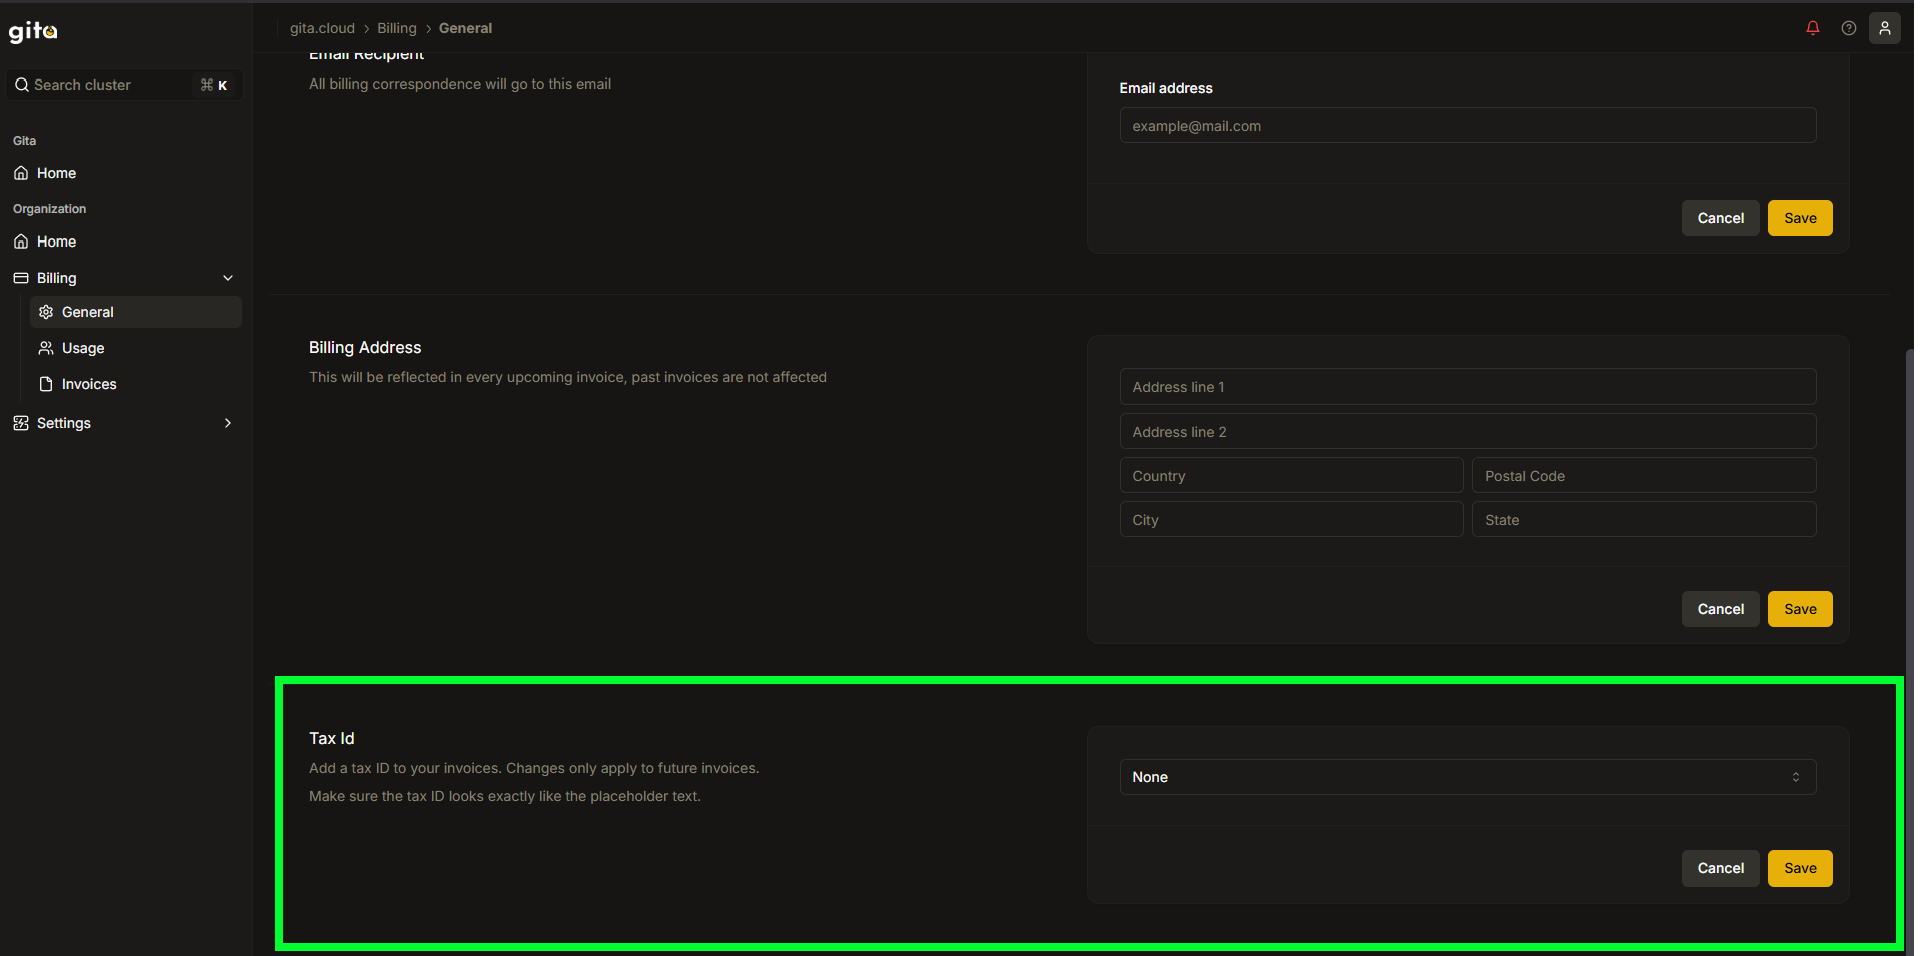
Image 09: Billing - Highlight 'Tax ID'
2. Usage Section
The Usage section allows users to monitor consumption and costs of active clusters in the account.
- In the left sidebar menu, click on Billing, select the Usage tab to view consumption and costs of active clusters in the account.
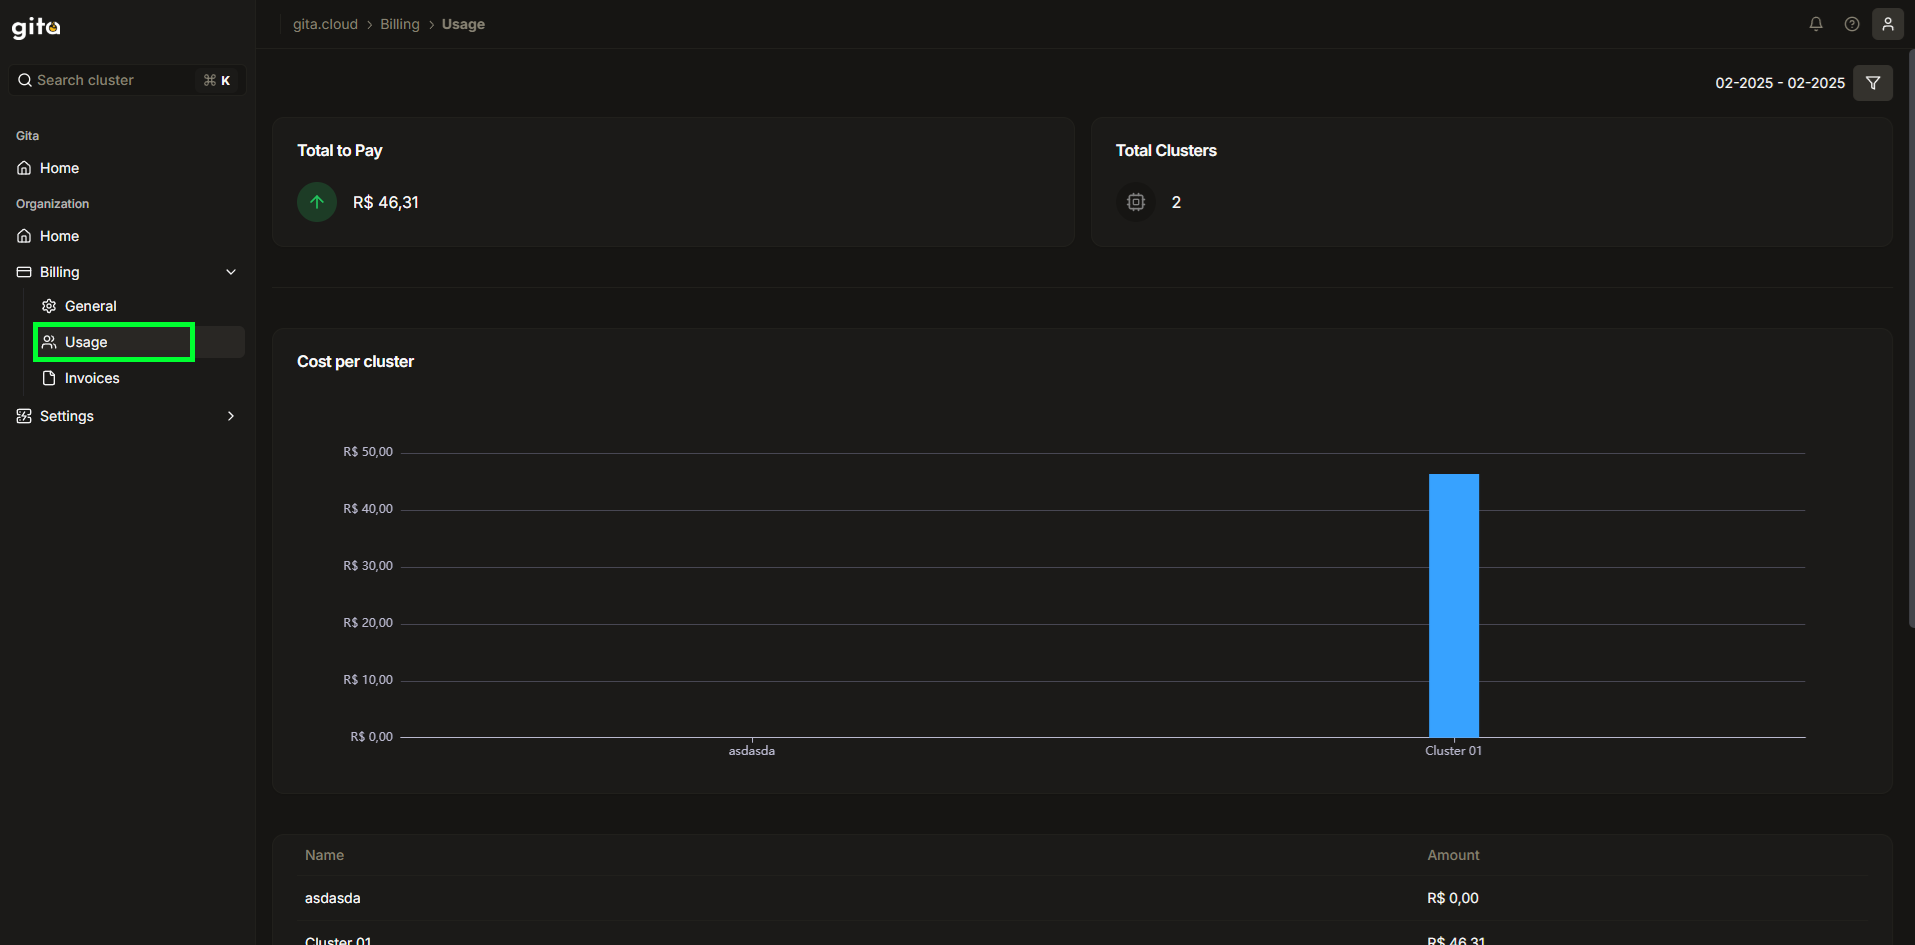
Image 10: Billing - Highlight 'Usage'
- Total to Pay: Displays the accumulated amount for cluster usage.
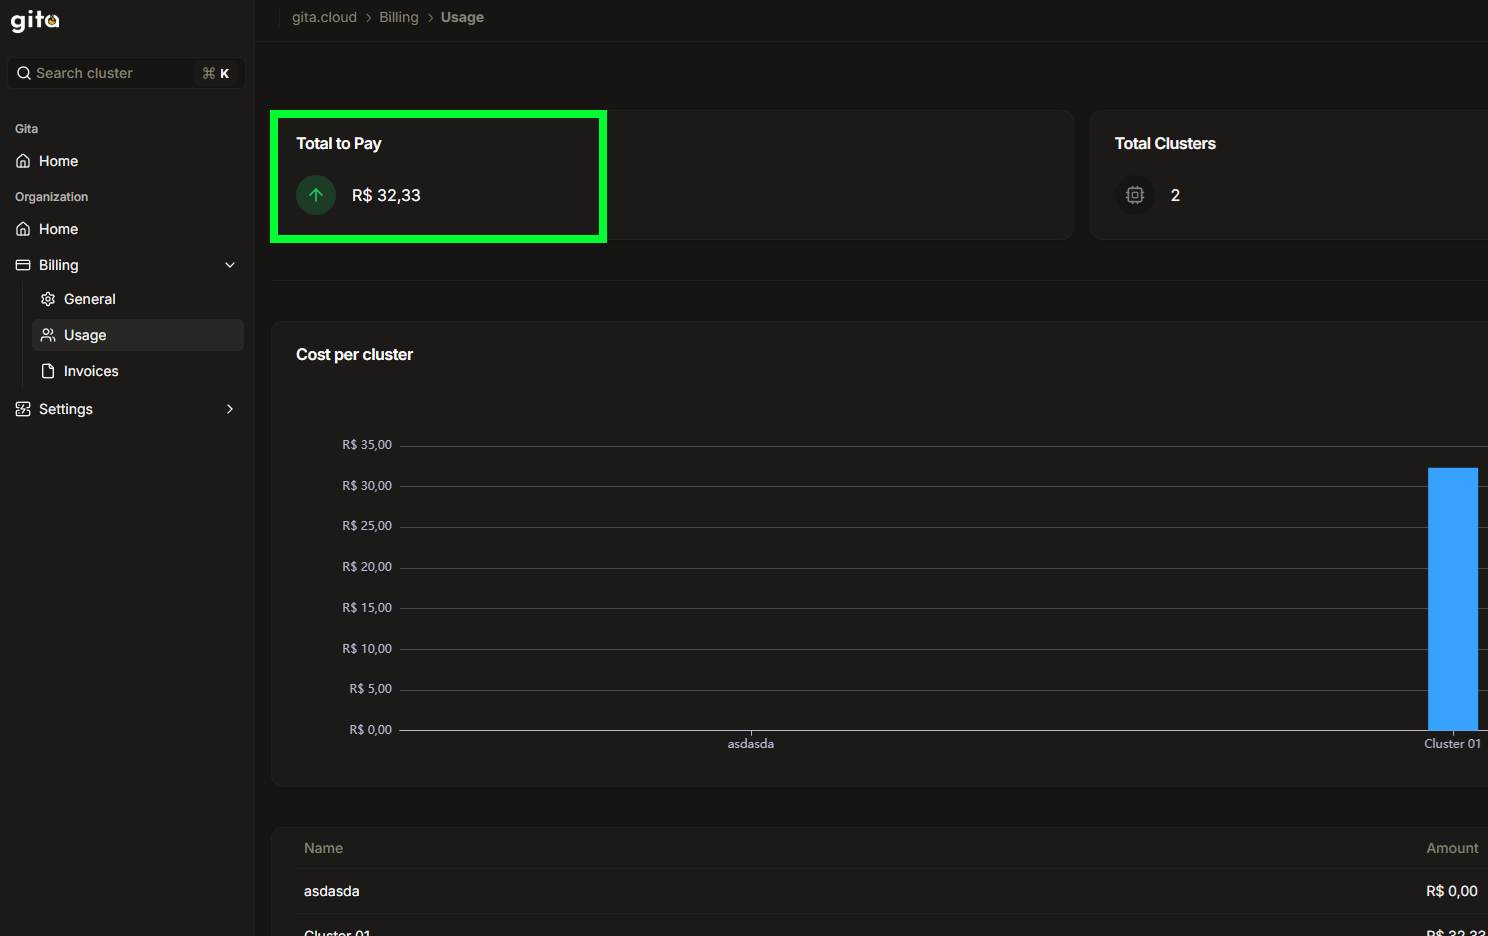
Image 11: Billing - Highlight 'Total to pay'
- Total Clusters: Shows the total number of clusters in use.
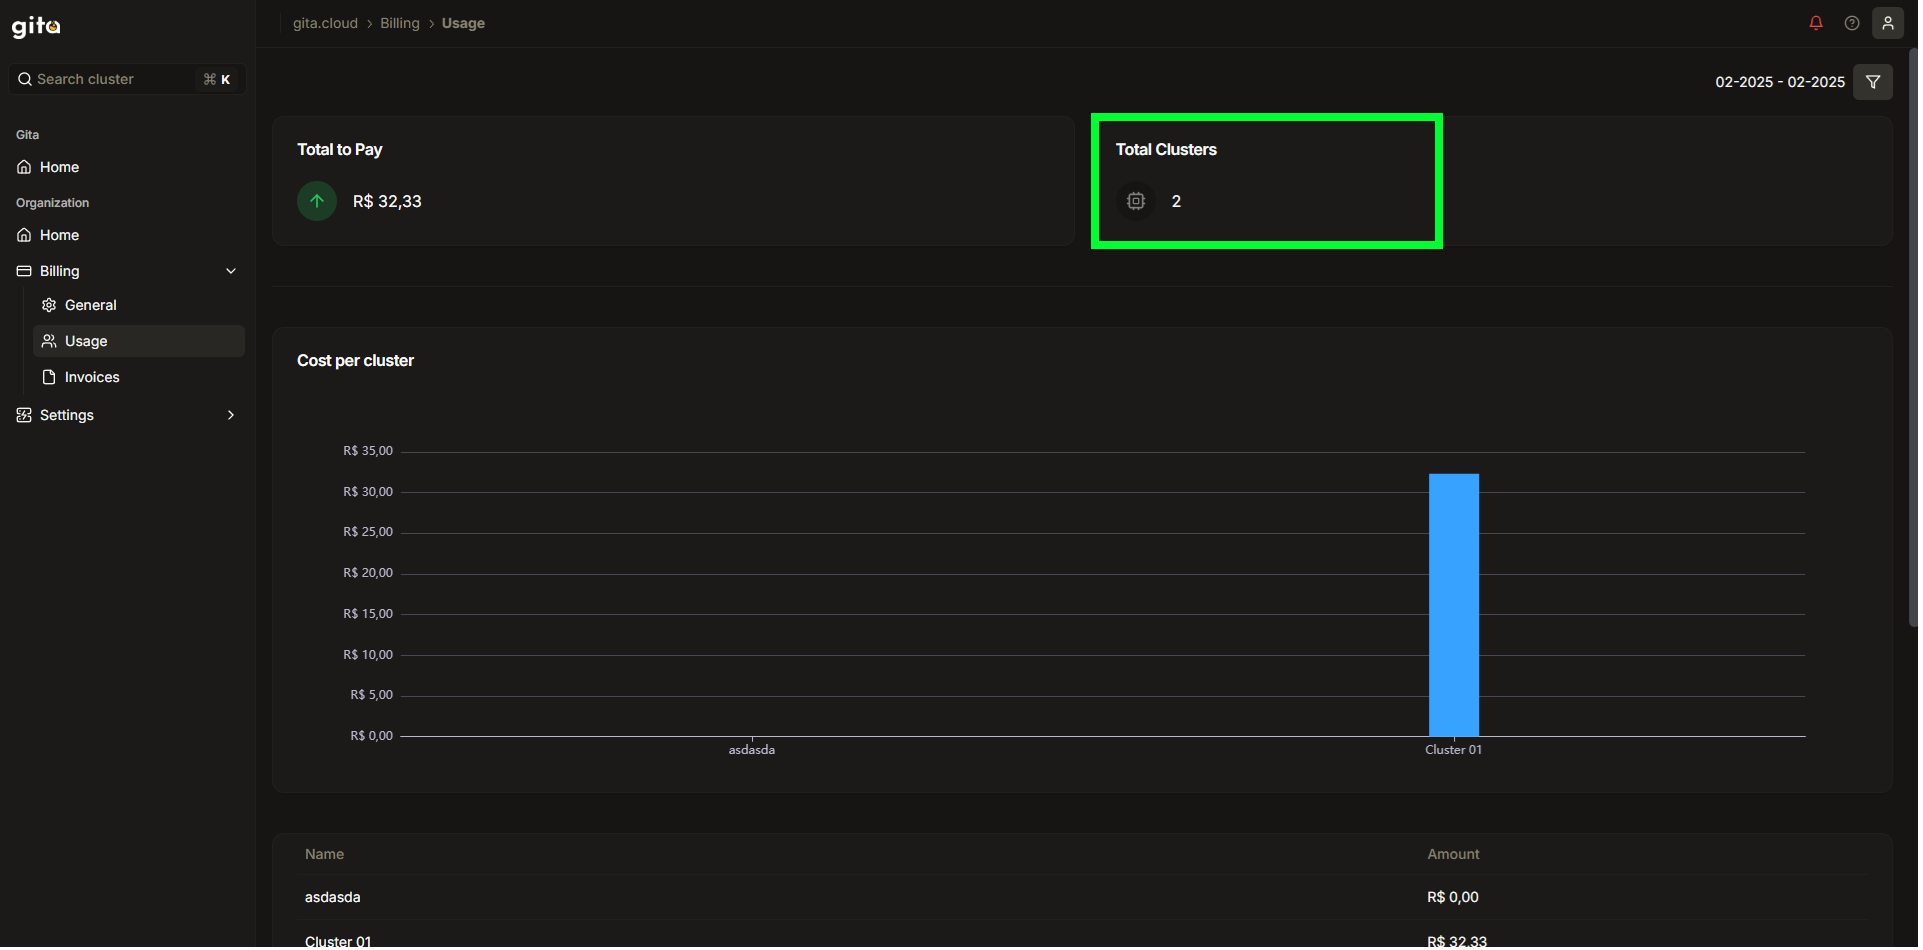
Image 12: Billing - Highlight 'Total Clusters'
- Cost per Cluster Graph: Presents a graphical view of costs per cluster.
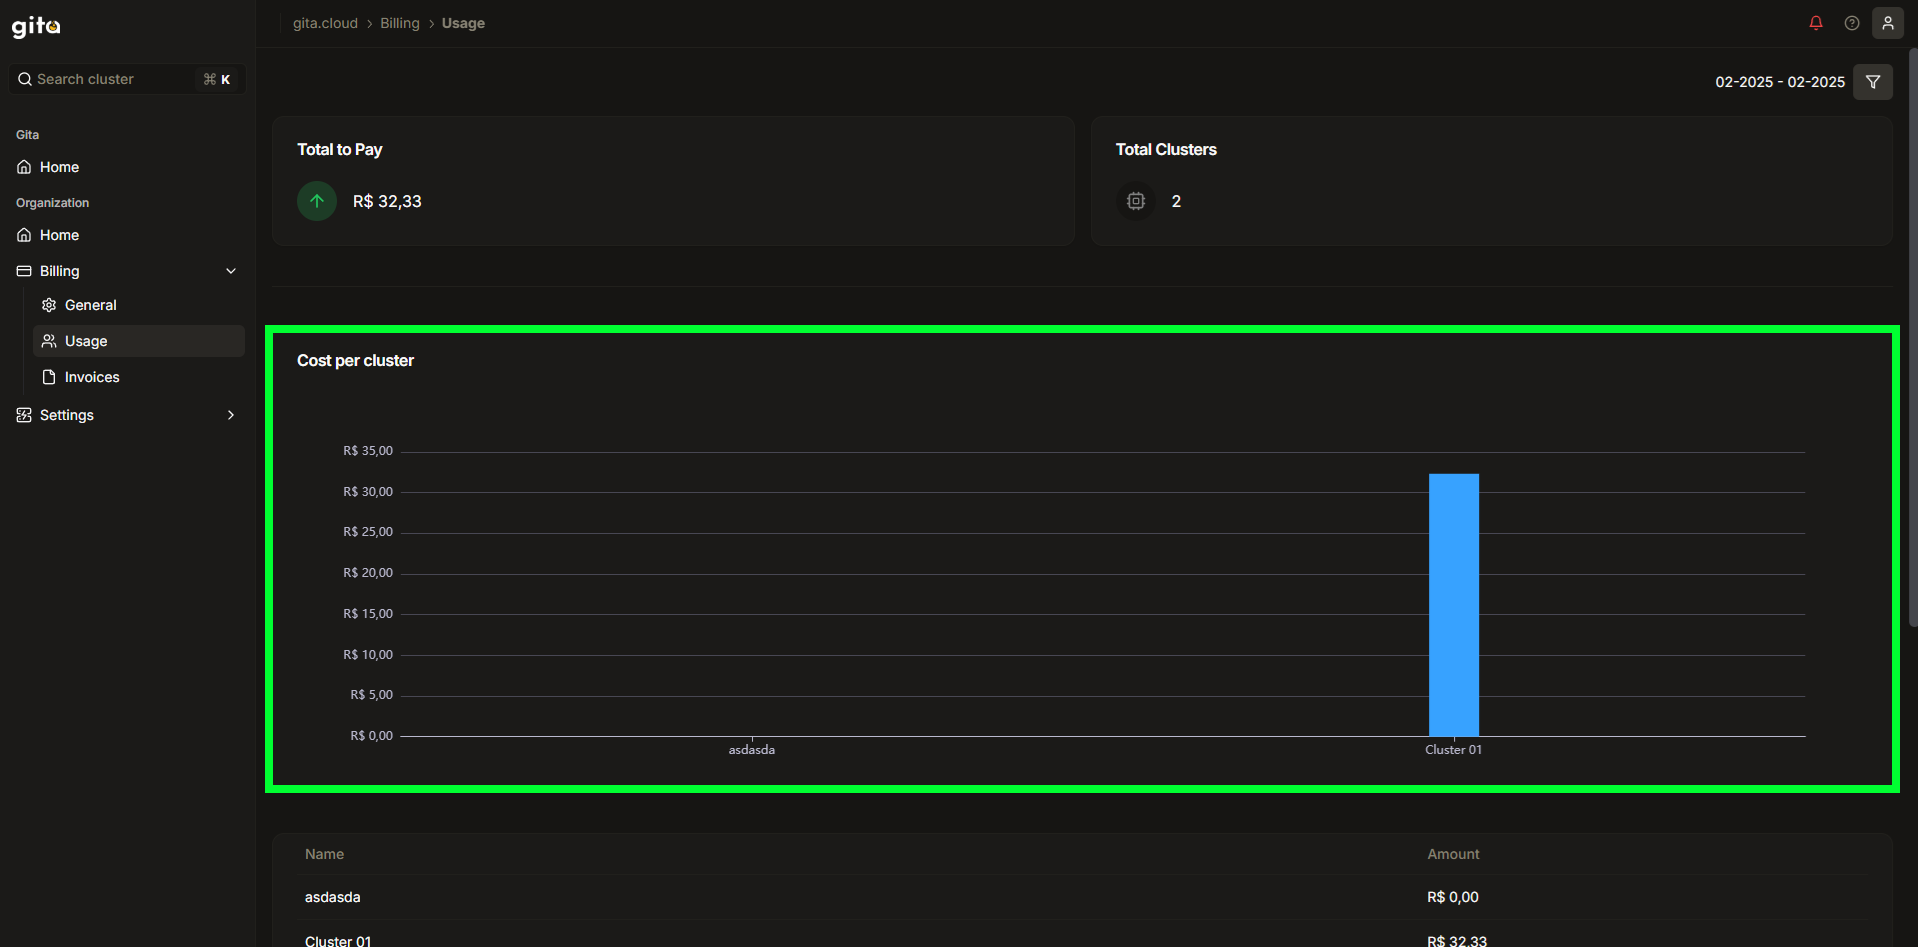
Image 13: Billing - Highlight 'Graph - Cost per cluster'
- Cost per Cluster Table: Lists each cluster and its respective consumption. You can also use filters for a more detailed analysis by time period.
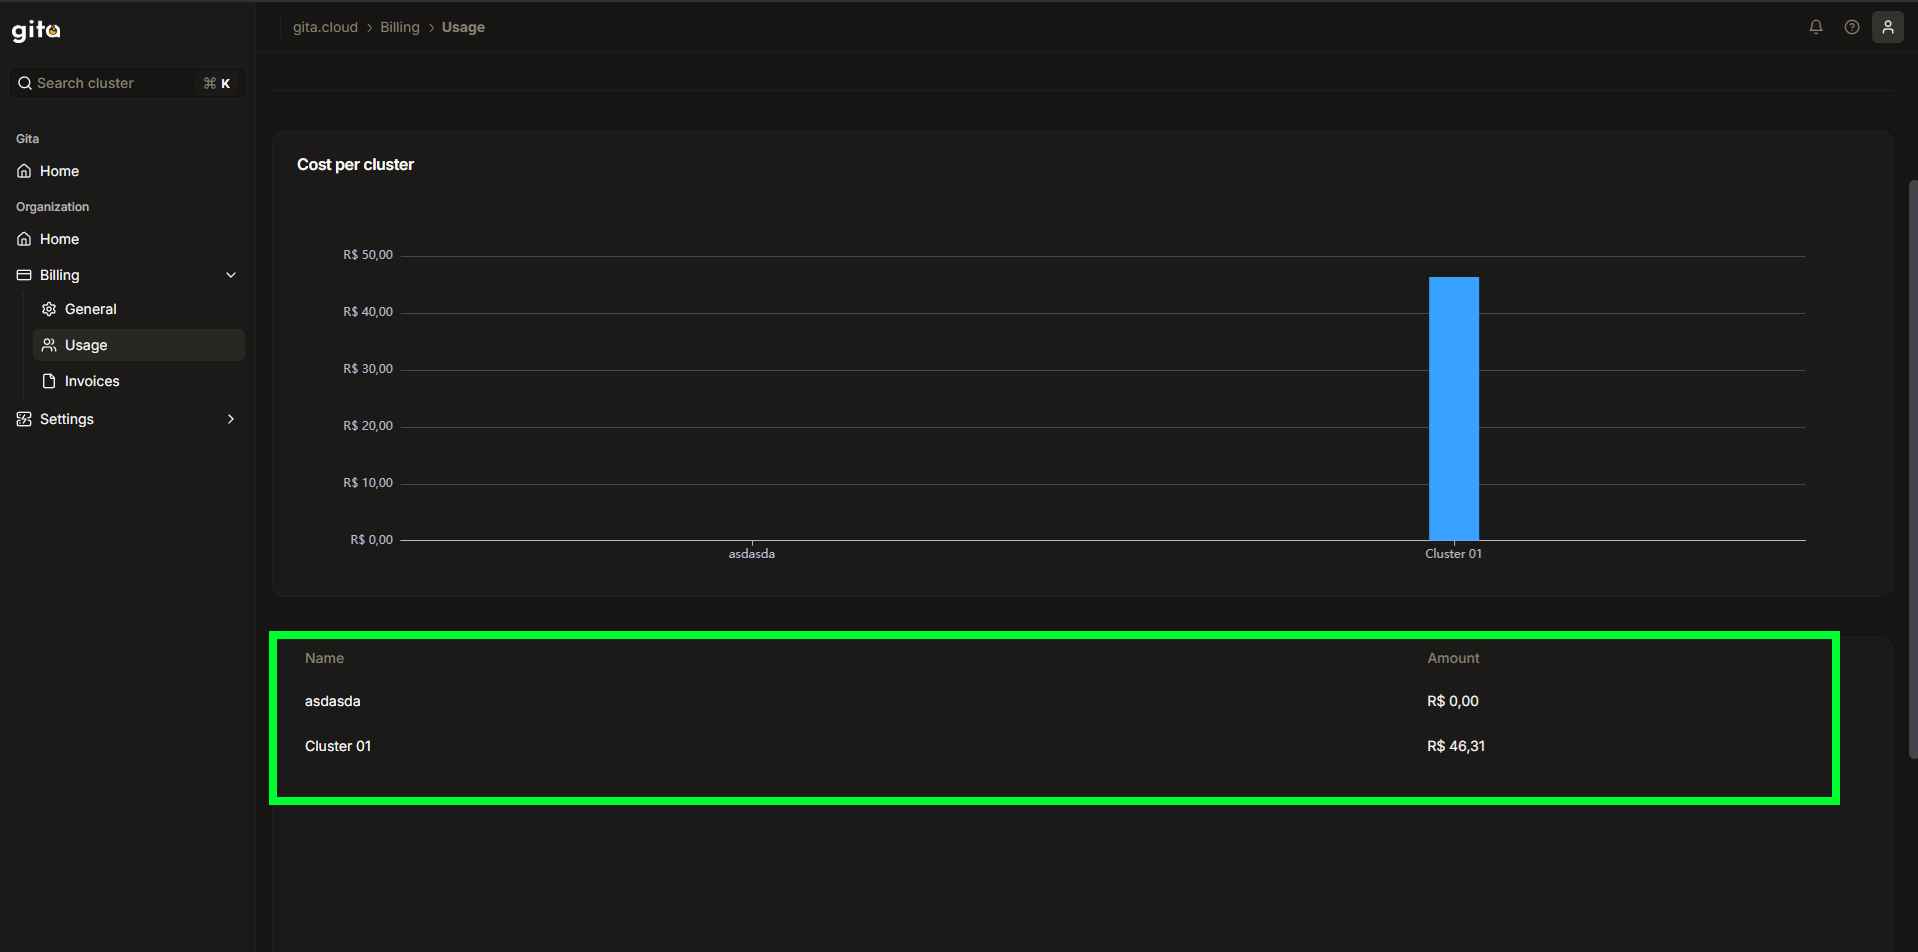
Image 14: Billing - Highlight 'Table - Cost per cluster'
3. Invoices Section
The Invoices tab allows users to view and manage all invoices issued to the account.
- In the left sidebar menu, click on Billing.
- Select the Invoices tab to view the list of charges.
- Available Features in the Invoices Section
-
Invoice Listing
- Status (Paid, Pending, Overdue)
- Invoice Number
- Total Amount
- Due Date
-
Download and View Invoices
- Invoices can be downloaded in PDF format.
- To access details, click on the corresponding line.
-
Payment Status
- Identifies pending, overdue and paid invoices.
- Allows payment regularization directly through the platform.